Survey description
We have initiated the largest ever survey of red giant SiO maser sources in the Galactic bulge and inner Galaxy. At the 7mm and 3mm wavelengths (43 GHz and 86 GHz) of the SiO maser we are not hindered by extinction, and extremely accurate stellar velocities (< 1km/s) and positions are determined in one minute of integration time per source. The observations of up to ∼28,000 red giant SiO maser sources with a now demonstrated detection rate of 60-70% will yield numbers comparable to optical surveys, but with the additional strength of a much more thorough coverage of the highly obscured inner Galaxy. The number of sources will be large enough to trace complex structures and minority populations. The velocity structure of these tracers is to be compared with the kinematic structures seen in molecular gas in the Galactic plane, including the bulge, disk and center, and thereby highlight kinematically coherent (possibly younger) stellar systems, complex orbit structure in the bar, or stellar streams resulting from recently infallen systems. Modeling of the bar and bulge dynamics will be done using the new kinematic information in the inner Galaxy region. Our survey will also yield sufficiently luminous SiO masers suitable for follow-up orbit and parallax determination using VLBI. A specific aim is to determine in detail orbits of stars supporting the stellar bar. As the SiO maser stars are detectable both near the obscured plane and Center as well as in regions with less optical extinction, there will be a solid connection to optical studies.
Area covered on the sky:
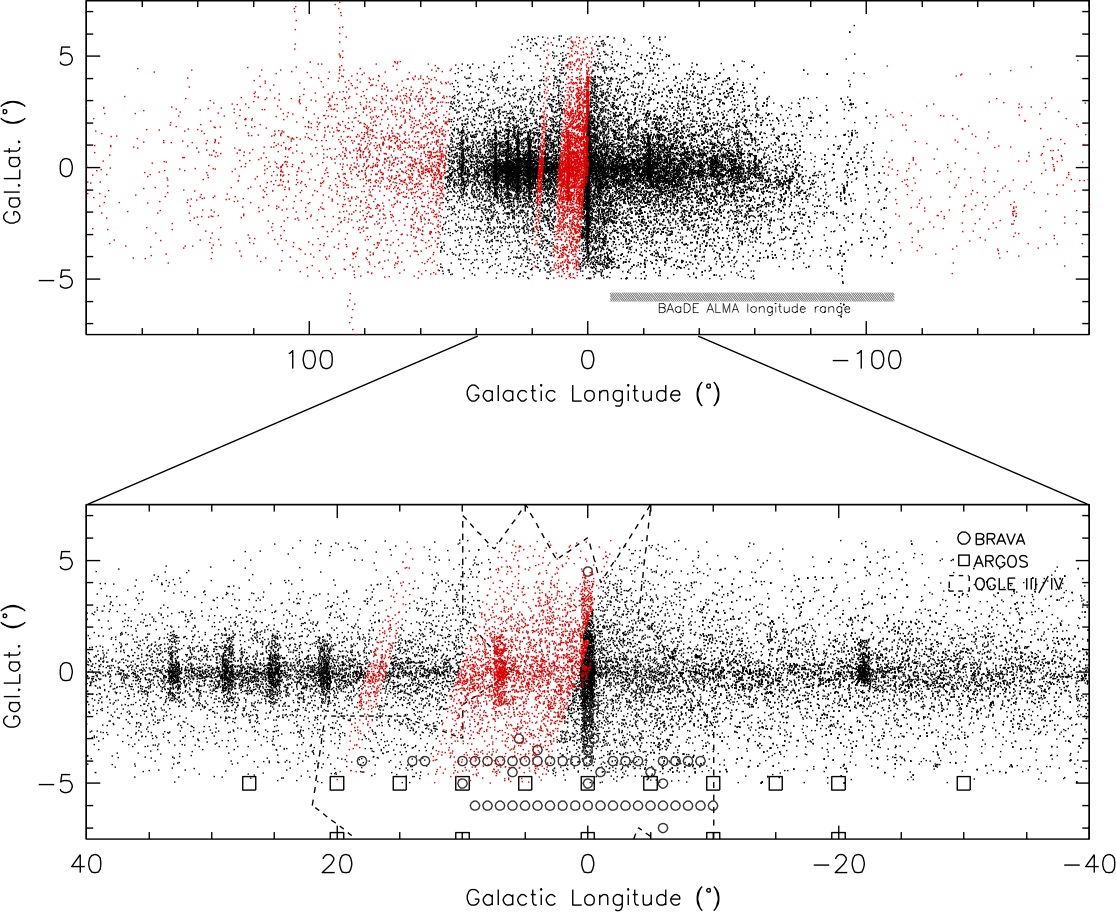
Below is a plot showing the BAaDE targets, covering a region of
± 6 ° latitude along the full Galactic plane. The sources
are selected to harbor dusty envelopes as indicated by their MSX
color. Compared to optical surveys (some of which are indicated in the
figure below), BAaDE covers the whole plane and in particular BAaDE
reaches all latitudes.

Spectral coverage at the VLA:
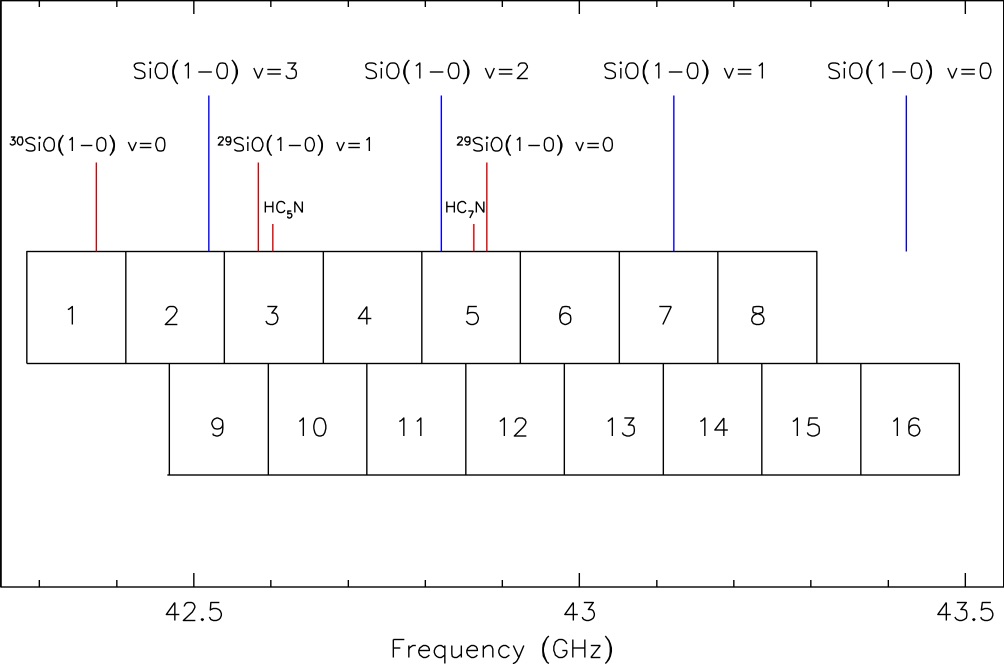
The VLA observational setup, using two base bands, is shown in the figure below. Interesting transitions falling inside the bandwidth are marked in Figure 2, and their rest frequencies listed in the table below.

| Oxygen-rich transitions | Rest frequency (MHz) | Carbon-rich transitions |
|---|---|---|
| ————————————————————————————————————————— | ||
| 30SiO (1-0) v=0 | 42373.341 | |
| SiO(1-0) v=3 | 42519.375 | |
| 29SiO(1-0) v=1 | 42583.827 | |
| 42602.153 | HC5N (16-15) | |
| 42674.192 | HCS+ (1-0) | |
| SiO (1-0) v=2 | 42820.570 | |
| 42863.206 | HC7N (38-37) | |
| 29SiO (1-0) v=0 | 42879.941 | |
| 42944.988 | SiC4 (14-13) | |
| SiO(1-0) v=1 | 43122.090 | |
| SiO(1-0) v=0 | 43423.853 | |
Spectral coverage at ALMA:
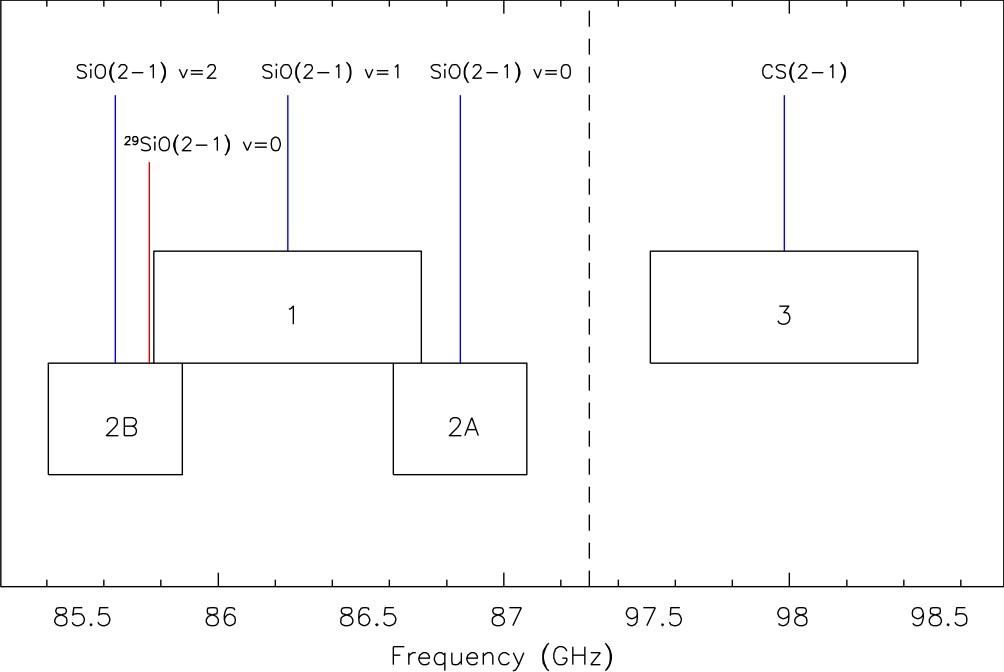
The ALMA observational setup uses four separate spectral windows, shown in Figure 3 below.

| Oxygen-rich transitions | Rest frequency (MHz) | Carbon-rich transitions |
|---|---|---|
| ————————————————————————————————————————— | ||
| 28SiO (2-1) v=2 | 85640.452 | |
| 29SiO (2-1) v=0 | 85759.188 | |
| 28SiO (2-1) v=1 | 86243.430 | |
| 86339.921 | H13CN (1-0) v=0 | |
| 86754.288 | H13CO+ (1-0) | |
| 28SiO(2-1) v=0 | 86846.995 | |
| 97980.950 | CS(2-1) | |